 In order to better perform our jobs as system engineers, we need to understand the territory of systems engineering, guide ourselves from point A to point B in that territory, and be able to communicate our results to our stakeholders. We understand our jobs by building and following a metaphorical map of the system engineering territory. We make decisions about how to get from one point to another. We communicate to our customers by providing them another simplified map of the results that they can understand and relate to. (Yes, the PowerPoint graphics so commonly used are a method of describing maps.)
You’re probably wondering why I discuss metaphorical maps and not the specific details of the system engineering process. The reason is simple. Often we’re stuck in a very specific way of thinking. An intellectual rut, if you will. We’re locked into specific interpretations of our jobs and processes. By thinking metaphorically, sometimes we can see relationships and open up to ideas we wouldn’t see without the metaphorical view. If you’re willing, let’s explore this metaphor together. Let’s back up, and ask ourselves, what is a map in general?
What is a Map?
For once, the dictionary fails us by not providing a good definition of map, so instead we turn to Wikipedia, where we learn that a map is:
In a typical road map, as you might see on Google Maps, Bing, Apple Maps, or Waze (or many others) we see geographic regions and their relationships. Some of the information includes relationships between cities via roads and relative locations. We also see municipal boundaries and geopolitical extents. We can see the relationships between cities and geographic entities such as rivers, lakes, mountains and shorelines. Using more detailed views, we can delve down to the relationships between individual addresses and the corresponding cities and roads.
Of course, there are many different kinds of maps. Maps have a specific scope and purpose, a specific theme. Geographical, or topographical, maps are the most commonly used, but there are also many others. Aeronautical maps that show airspace restrictions, radio frequencies and general aviation information. Topological maps show relationships and connections, but no extraneous information (such as scale or distance) depending on the application. Network maps show interconnectivity among communications nodes. There are too many types of maps to mention here, but the interested reader can look into the subject of cartography on Wikipedia.
Given all the information on the maps, what do maps do for you?
- Provide information to find where you are, whether it be a city address or a network node (navigation)
- Describe the lay of the land
- Show terrain, entities, and relative placement of the entities whether city addresses or network nodes
- Show important llandmarks
- Show entities of interest for the subject area
- Enable guidance
- Provide information needed to decide how to get from one node to another
- Allow you to find the best routes
There are things that maps do not do. For example, a map can enable guidance on your available travel options, but the map cannot tell you how to get from point A to point B. Should you travel by car, or by airplane? The map cannot answer that. Should you detour to visit an attraction, or drive straight through? The map cannot make decisions for you. The map, by itself, cannot tell you the process of getting from A to B, nor the decisions along the way. It only provides the information necessary to enable the decisions. Without the information, you can’t make the decisions necessary to follow your process.
To cross terrain, we need both a map and a process for making travel decisions. The common GPS system in your car or on your phone is a combination of a map, and an application to handle decision making. In this case, the decision making is restricted to particular assumptions, such as travel by automobile, and that the goal is either the shortest distance or quickest route.
If you think about it, a map comes pretty close to fulfilling my definition of a model:
- it’s a visual representation
- it’s a pattern of something else, which already exists in this case
- it captures information on structure, data and inferences
- often it is formalized, as in the case of GPS systems which store the map info in a database
Maps and Processes
System engineering is generally considered a set of processes with goals. The main goal is to move from customer concept to design specification that can be handed off to other disciplines, like moving from one map point to another. Where’s the information necessary to decide how to move? We describe our processes in System Engineering Management Plans (SEMPs) and measure our compliance to our processes, but we very poorly formalize the necessary information. I believe the missing ingredient is the map of the SE landscape that provides the information for the necessary decision-making.
In my opinion, system engineers have spent decades developing processes, but far too little time developing and formalizing the map of the SE territory. In order to make decisions, we need a complete model of the system engineering territory, including a model of the SE discipline itself and a model of the customer needs.
When building models and maps of decision-making processes, we start to venture into the realm of Enterprise Architecture, or EA. For the purposes of this article, I’ll avoid any Enterprise Architecture specific terms. My views on EA will be discussed in another article.
The system engineering territory does not need to be explored like a poorly known Louisiana Purchase by the Lewis and Clark Expedition. (A part of early United States expansion in 1804-1806.) We’ve already covered the SE territory, but we haven’t documented it very well. There have been maps of SE, like the image bellow of the schema from an old SE tool in the 1990’s, so the knowledge is there. We just haven’t made that knowledge persistent.
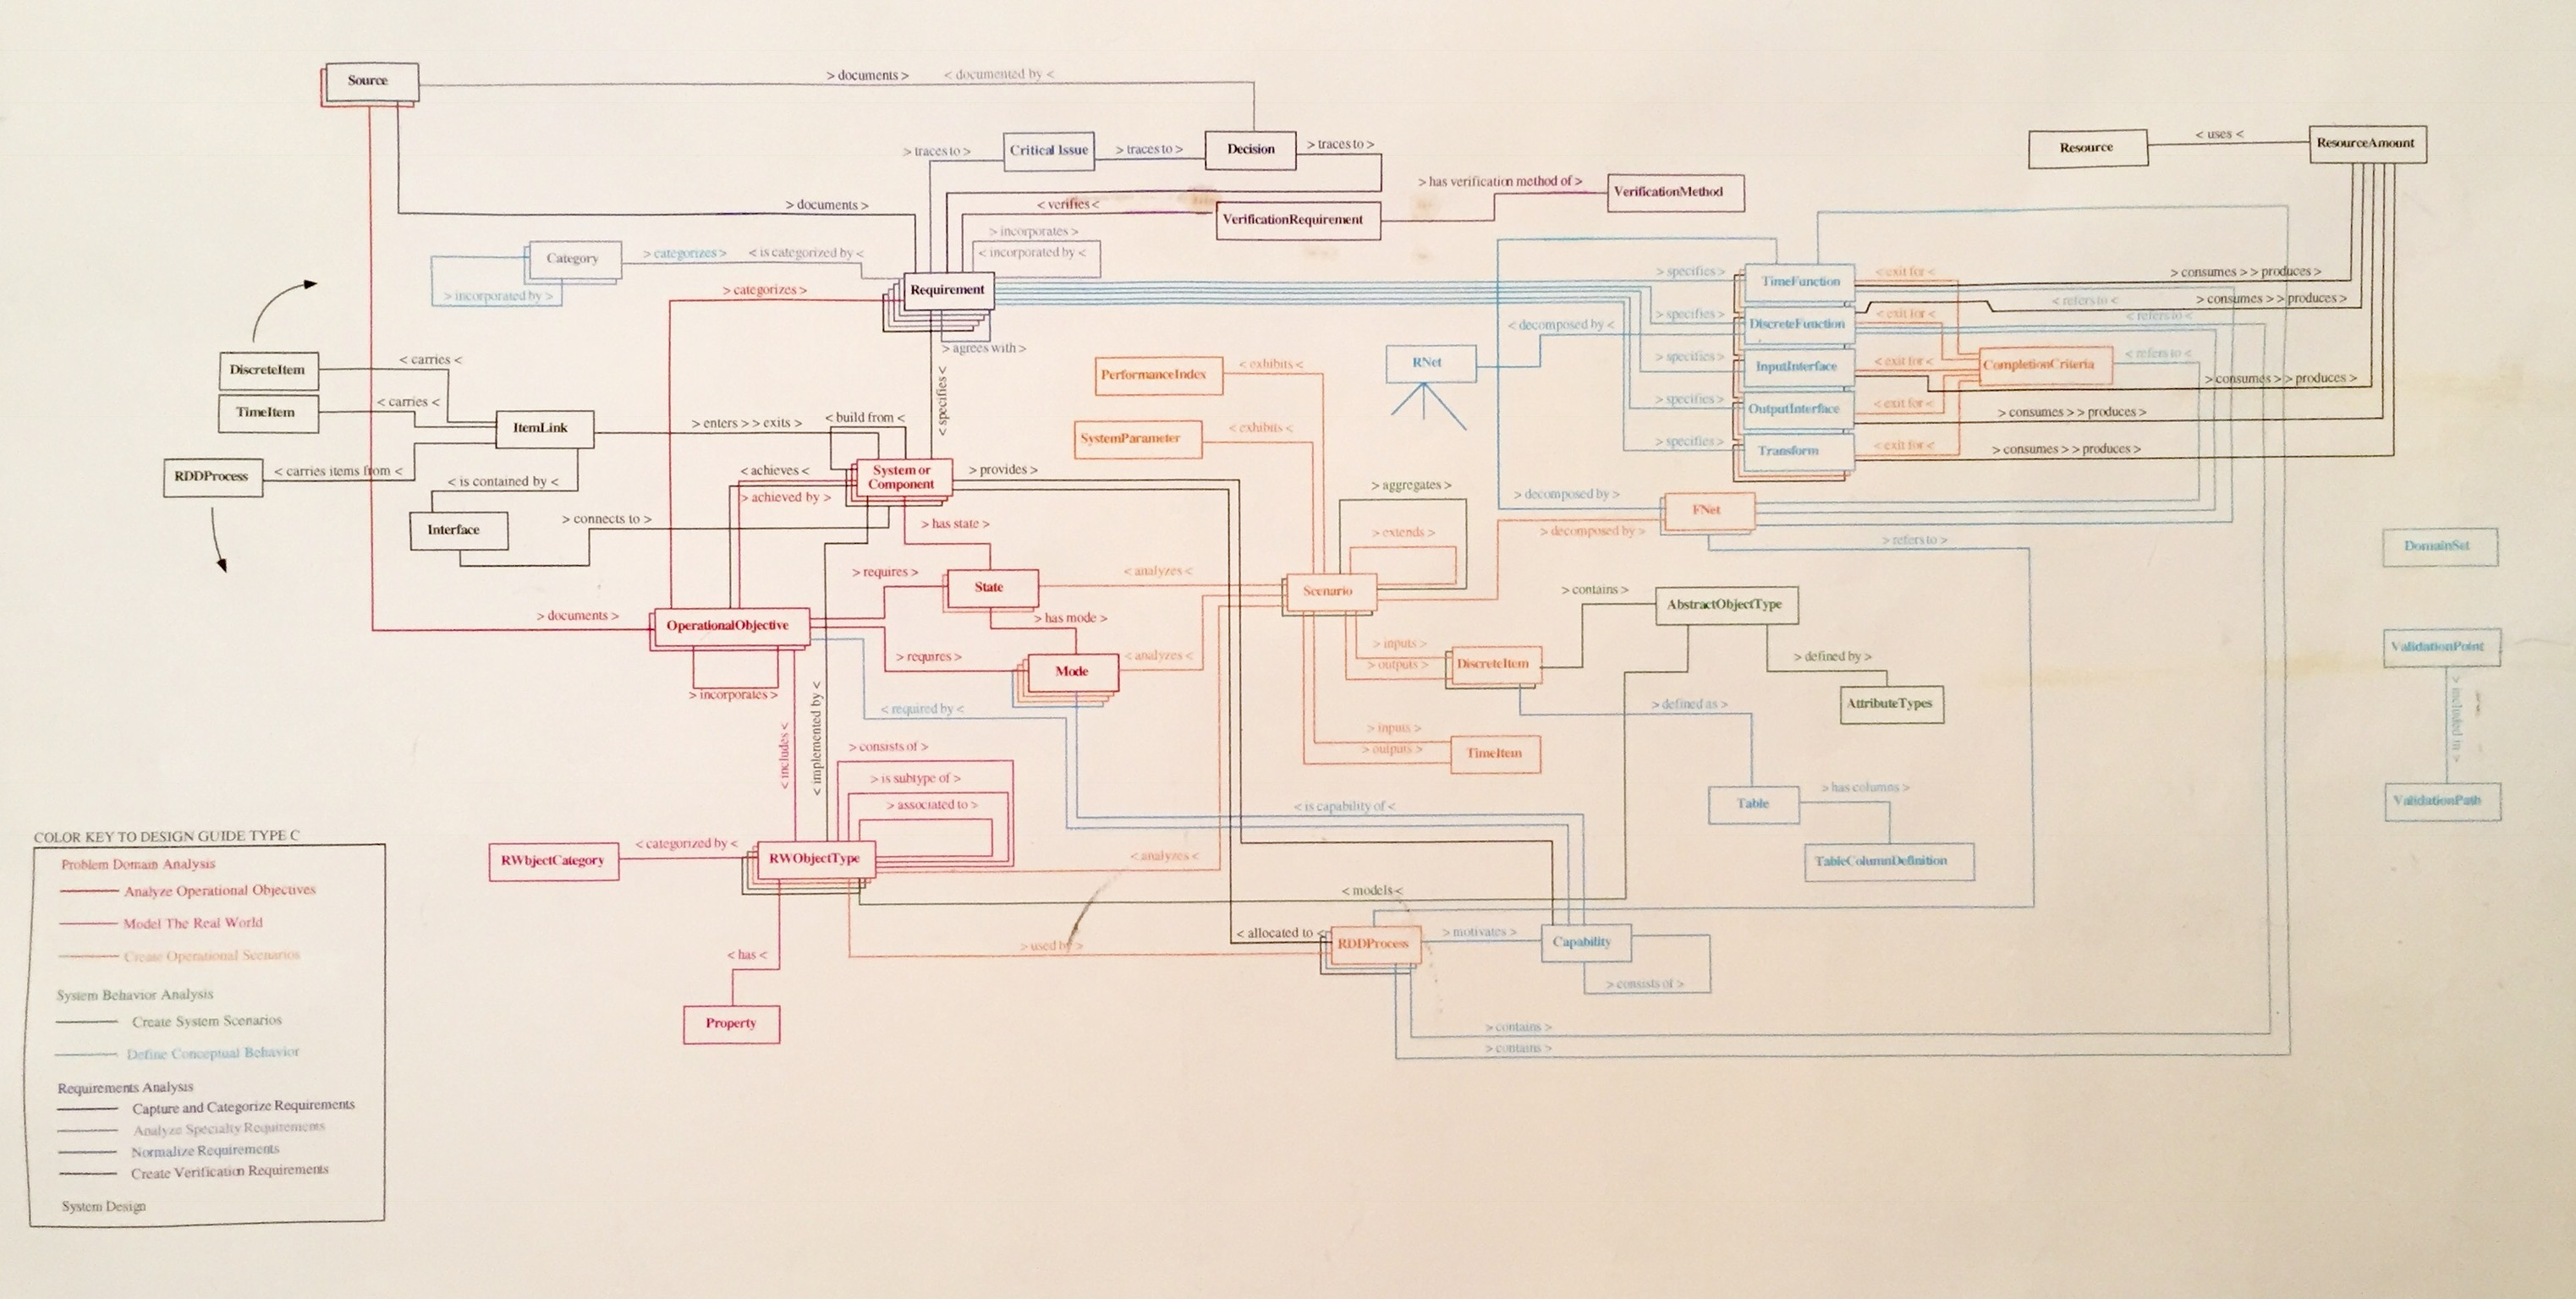
This particular map is of “Design Guide C” from the tool RDD-100 by Ascent Logic, Inc. Oddly enough, the design guide (1 of 4 maps) was only documented in an alphabetically organized reference guide; this visual diagram was never provided by the vendor. The picture only exists because I spent several days back in the 90’s exploring the reference guide to divine these visual relationships.
I believe that understanding the basic system engineering entities and their relationships is the key to improving the entire process of system engineering, and the solutions we generate. In the next article, I’ll look at a simplified “map” of system engineering and what needs to be done to make it useful.